
Table of contents
Did you know that 84% of content publishers have turned their attention toward affiliate marketing? This multi-billion dollar industry has huge earning potential, and the secret to success is understanding and interpreting all the right data. To do this, you need an affiliate dashboard, which is an area where Strackr can help.
Strackr is a comprehensive affiliate tool built for content developers. Users are able to access a wide range of analytical data and stats from one dynamic affiliate dashboard. You can also integrate us with a range of third-party apps like Slack and Google Analytics for a comprehensive experience across your entire work stack.
Join us as we discuss what affiliate dashboards are, why you need them, and the different types available to you.
What are Affiliate Dashboards?
Affiliate dashboards gather your data from your affiliate marketing campaigns and present them to you in clear and easy-to-understand formats. They analyze metrics from all your networks and affiliate programs, such as transactions and clicks, and generate reports based on their findings.
These reports allow affiliate marketers to evaluate their marketing performances, allowing you to optimize campaigns to maximize their conversions and sales. With affiliate marketing dashboards, affiliates can learn which networks generate the most revenue and compare them with the ones that are underperforming.

The precise capabilities of your affiliate dashboard will depend on which software you choose. For instance, if you opt for Strackr, you’ll be able to manage all of your affiliate networks from our dashboard. And the best thing? We support over 190+ affiliate networks, with the option to integrate more at our users’ requests.
How Can Affiliate Dashboards Benefit You?
Save You Money
Affiliate marketing is known for being a low-cost business. And the use of affiliate dashboards can save your affiliate team even more money.
Traditionally, retailers gather data and create spreadsheet reports with the likes of Excel. But as we’re sure you know, this can be time-consuming. When you opt for affiliate dashboards instead, reports are automatically generated for you. That means you can spend your valuable time on other tasks like promoting and selling affiliate products.
Greater Collaboration
Affiliate dashboards make data collaboration easier. With these tools, affiliate marketers can share information with their team through email, Slack, and social media. Additionally, users can either download their reports or simply take screenshots of their dashboards. These can then be easily incorporated into PowerPoint presentations so everyone understands the data.
An Aggregated Experience
Affiliate dashboards can give you a complete picture of your affiliate data. With everything being aggregated, marketers don’t need to waste time pulling data from different sources. With this method, you also risk working with incomplete or even conflicting data. Affiliate dashboards serve as your go-to place for all your data sets.
Things to Consider When Choosing Affiliate Dashboards
User-Friendly Interface
Even the most comprehensive affiliate dashboards need to be easy to use, especially for those starting out in affiliate marketing. An interface that is smooth and clear while also being simple to navigate is the recipe for an ideal dashboard experience.
If there are multiple people using the dashboard, having to train everyone on how to use it becomes time-consuming. With a user-friendly option, everyone should be able to use it straight away and learn as they go.
A good option for testing out the user-friendliness of affiliate dashboards is to explore a demo or free version of the software. Many brands, including Strackr, have this option so you can check its ease of use before committing to a purchase.
Analytics
Your affiliate dashboard should track a good range of metrics so you can perform your analytics analysis. Thorough, in-depth data will help you understand the scope of your campaigns and their success. From your data, you can identify weak spots within your affiliate campaigns and come up with solutions to rectify them.
Develop strategies to replicate successful aspects of your campaigns and even improve them. This stops you from wasting time on strategies that simply aren’t working.
For example, if an email affiliate marketing campaign generated a lot of clicks through to your product page but result in very few purchases, you’d look at the page design and product description to identify what might be putting people off. Conversely, without click-through data, it would be much more difficult to narrow down on where the problem lies.
Easy Integration
Integration is a prominent aspect of affiliate dashboards. When you’re considering which one to choose, take into account how easy it is to integrate with all your different networks. With Strackr, for example, content developers can unify all their data - including data from custom-made websites - into one API. This level of integration makes Strackr a flexible choice with easy integration.
Types of Affiliate Dashboards
All-in-One-Affiliate Dashboards

An all-in-one dashboard gives you a high-level oversight of your affiliate marketing performance. It’s a useful tool for consolidating data from different affiliate networks and channels.
Equally, with software like Strackr, you can separate data overviews into different channels. For example, if you have two websites, both connected to five different affiliate networks, you can see consolidated data from the five networks for each of these websites or view the combined data for both.
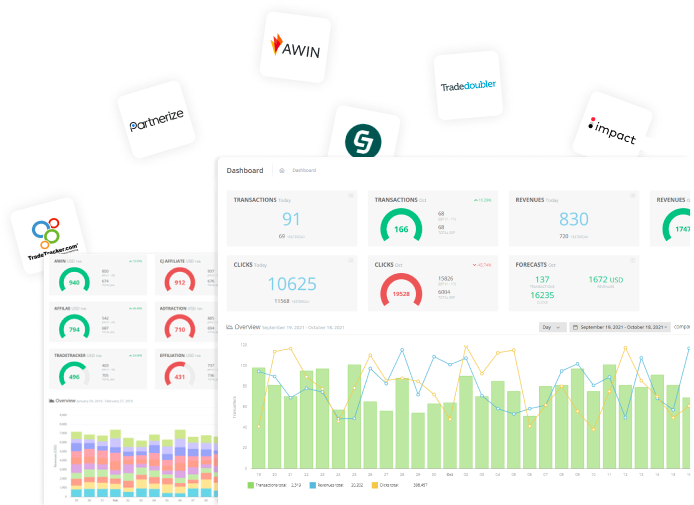
All-in-one dashboards can contain the following information:
-
Transactions: These are your transactions from all of your networks. There is a monthly figure, as well as a daily one. In the example above, you’ll also notice it clearly displays yesterday’s transactions underneath for easy comparison.
-
Revenue: This is the total revenue from your affiliate networks. Again, these are split into monthly and daily revenue.
-
Clicks: How many clicks your affiliate links have got in a day, the day before, and per month. Compare this with the number of transactions to determine your conversion rate. Although you will have considerably more clicks than transactions, the closer these are together, the more successful your conversion strategy is.
-
Forecast: Strackr works out a forecast by multiplying your daily figures with the number of days in the given month.
-
Overview graph: This is a bar graph that highlights the changes between clicks, transactions, and revenue in a set time frame. You can alter the time frame to show data from a day, week, month, or year. Also, you may choose to compare your current data with previous data.
Advertisers Monitoring Dashboard

With an advertising campaign dashboard, you get an overview of earnings from each advertiser. The affiliates that saw an increase in sales from last month are green, while the ones that saw a decrease are red. You also get a handy percentage accompanied by a little arrow to mark the rate at which your sales have increased or decreased compared to the previous month. This clear presentation enables affiliate marketers to get a quick and clear overview of the success of their marketing efforts as a whole.
If you log into your advertisers' dashboard and are faced with lots of red graphs and very few green ones, for example, it’s safe to say your campaigns are probably not meeting your expectations. Therefore, you will need to decipher why and alter your efforts accordingly.
Equally, it’s a good idea to look at how your marketing strategies differ between the increased and decreased sales across your networks. Your task is to discover why you succeeded in some and not others. For instance, if you’re an affiliate marketing content creator, you might look at the content you created and the types of topics you covered. Also, look at how often you posted on social media, along with your landing pages for each network's products.
Devices Monitoring Dashboard


The Device dashboard is relatively self-explanatory. It shows users what devices customers have used to interact with them. Click on the ‘Week’ tab in the top right-hand corner to change the data displayed to reflect stats by ‘Day’, ‘Week’, ‘Month’, or ‘Year’.
Looking at the graphs from these different perspectives will help you spot any device trends. For example, you might see that more transactions occur on mobile devices on the weekend. In this case, you might consider focusing on advertising on the most mobile-friendly channels, like Instagram or TikTok, on the weekends.
Tracking transactions and interactions across devices also helps you gain a full picture of each customer journey. For example, oftentimes, customers research products and brands on one device and then complete transactions on another.
An important factor is the ability to share your graphs and charts with other team members. With Strackr, you can download this data as a PNG or CSV. You can email copies to other team members or use them to create marketing strategy presentations, allowing you to prioritize collaboration for better results.
Transactions

From your Strackr affiliates dashboard, you’ll find your transaction information by clicking on ‘Reports’ in the left-hand menu. Reports dashboards are more detailed than our previous examples. They hone in on all the transaction-related metrics for each affiliate network and advertiser.
In the example above, we’ve clicked on the top option in the list. You’ll notice it has expanded to display a wealth of data, including price, revenue, device, and operating system of the transaction. You can also view the timeline of the event. You might be able to see that there is one day between the Click and the Transaction. This indicates the customer might have gone away to think about the purchase or do some research before committing.
Products dashboard

The Products dashboard is an overview of each product and all the data surrounding it. By clicking on a product, you’ll expand it to reveal different information like Advertiser, Price, and Revenue. You can alter the date range for product data, and also search for specific ones, and download reports.
Your Products dashboard shows the time and date of each sale. From this, you can determine how well your sales have lined up with product promotions. If, for example, you created a social media post to promote a particular product but didn’t make any sales from the people who viewed it, you’ll understand that the promotion was not a success. You can therefore think about the reasons why and refine your promotions.
Performance Monitoring

Finally, your Performance dashboard can be found under the ‘Monitoring’ tab in the left-hand Strackr menu. This gives you a breakdown of different performance metrics. You’re presented with monetary figures, percentages, and a colorful graph. Included in the graph, you’ll find details regarding:
-
EPC (Earnings Per Click): In the graph above, the blue line represents your EPC within a given time frame.
-
AOV (Average Order Value) average: This is the red line in the graph above. It represents the average value of your orders within a set time frame.
-
Revenue Share: Represented with the green line in the graph, Revenue Share refers to your share of the sales you generated through your affiliate links. This is the revenue per sale minus the advertiser’s share.
-
CR (Conversion Rate): CR means the rate at which people who click on your links convert into paying customers.
Wrapping up
Affiliate dashboard software can provide valuable insights into your affiliate marketing campaigns. Analyzed correctly, they’ll help you refine your marketing efforts to publish better content that resonates more with your audience. Leveraging data, though, all depends on how well you read and interpret information. Much of this relies on clear data that’s presented in a visual and easy-to-read way.
Strackr strives to equip affiliate marketers with the right analytical tools to bolster their campaigns. Our dashboards include a wide selection of metrics. They enable you to get to the core of your analytical data to help you understand all the complexities of customer interaction. You can try Strackr for free for 30 days. Simply sign up to create an account.
Share
Affiliate dashboard
Connect all your affiliate networks with Strackr to access to unified statistics and tools.
Try for free